Electronic charts: special symbols
A special problem with electronic charts can arise when an out-of-date version of a navigational program is asked to read new editions of electronic charts.
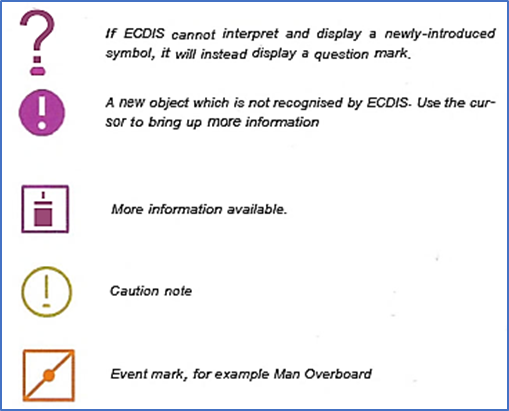
1. Information Symbols
This class of symbol displays more information when activated with the cursor. They comprise individual objects as wel as areas or lines.
The symbols are colour-coded according to the manufacturing agency. Purple = hydrographic institute, orange = the Navigator, light green = publisher.2. Areas
The appearance of areas such as anchorages, military training grounds, etc., look different on vectorised electronic charts when compared with paper charts. Some of the symbols that describe certain areas, such as a Traffic Separation Scheme, are by default always cisplayed on the screen, so that the area is not visible without an explanatory symbolВ
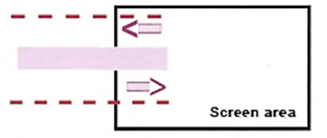
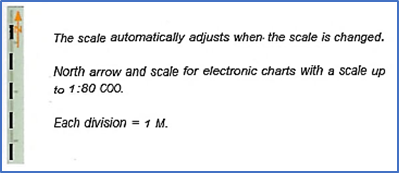
An example: the arrow symbol for a TSS rea moves automatically on the screen, so it is visible as long as other parts of the TSS symbol are seen
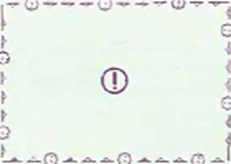
Ambiguities can occur when the boundaries of a special area fall outside of the area "epresented on the screen. Vector electronic cnarts solve this problem by covering the .-.hole area with a regular matrix of the appropriate symbol.
|
Caution note for an area. Display more information with the help of the cursor |
When the boundaries of a special area are not visible on the screen, the special area is designated by duplication of the appropriate symbol over the entire area. In this case, Anchoring Forbidden |
Some symbols are directly associated with ENC special characteristics and lack an equivalent on paper charts.
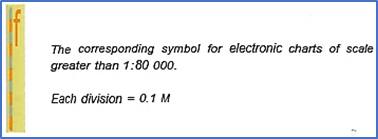
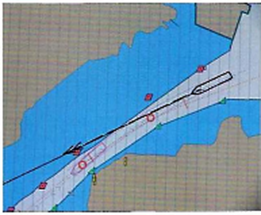
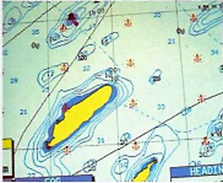
Vertical lines denote that the chart image has been zoomed above the published scale
 A network pattern can be overlaid on the area inside the safety contour
 +7 (812) 4-673-673