 +7 (812) 4-673-673
Synchronous use of different types of electronic chart
If electronic charts other than ENCs are used in ECDIS then a message will be presented that warns the Navigator to use official , corrected charts for navigation. On the screen the parts of the image made from unofficial charts will be indicated by a red boundary with short red diagonal lineson the unofficial side.
If the area covered by the ECDIS display includes waters for which no ENC at a scale appropriate for navigation is available, the areas representing those waters should carry an indication (see appendix 5) to the mariner to refer to the paper chart or to the RCDS mode of operation.
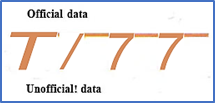 The boundary between official and unofficial chart data in ECDIS
When an ENC is loaded into an ECDIS, it is stored in the system database, which is called SENC: Here the ENC data is translated to the manufacturer's internal data format. This is “ecessary because S-57 is not optimized for operation in real time. This operation is performed without loss of information.
The usefulness and reliability of the information presented on me plotter screen is affected by the quality of the nautical survey (newer better than old, shipping lanes better than outside the lanes, i.e. just as for paper charts) as well as the effects of tide, sea level and other geological forces.
Experience has shown that many Navigators are deceived by seeing the symbol for their vessel when presented on the electronic chart. This, together with an excessive use of the zoomin function, has given rise to unrealistic expectations regarding the relationship between the symbol for the vessel and those for shoals (i.e. going too close!).
If a larger-scale cell is not available then excessive zooming of a small-scale chart will not help.
A great deal of nautical survey data has not been positioned by DGNSS, but modern vector charts easily give the impression of being very accurate, even when the underlying data is 100 years old and obtained using a quite different technology. IHO has a system that classifies the quality of nautical surveys according to "Zones of Confidence".
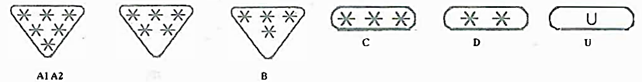
Zone of Confidence symbols according to 5-52
An electronic chart in a navigational system can be affected by:
The navigational program that extracts the electronic chart data from me storage memory and projects it onto the screen. There is a risk of error if the ~avigational system is not up-to-date. For example, older programs may miss alterations in the "Presentation Library" ;S-52) when applied to S-57 charts.
The manufacturing quality and standard of the electronic chart. Official electronic charts are governed by S-52 and S-57. Privately-issued electronic charts have their own standards regarding symbols and the scales at which they shall be displayed.
The correction status of the manufacturer's database and the chart database on board.
The Navigator can affect the screen image by personal settings. This won't introduce errors but it may result in an image that isn't the one needed by the Navigator at a given moment.
There are a fair number of groundings behind which one can suspect some problem or mistake with settings. However this is often difficult to prove after the event When PRIDE OF CANTERBURY hit a wreck, it was considered to be highly likely that the navigation system settings were such that the mark for the wreck was not clearly displayed on the screen
If navigating with a satellite receiver and official ENC charts then no general coordinate error will exist between them - everything is related to WGS-84.
However, regarding other electronic charts, there are over 100 different coordinate systems (Horizontal Datum, Geodetic Datum). Most of these can be converted to WSG-84 (unrecognisable coordinate systems do exist). An incorrectly set coordinate system will immediately result in errors when used in a navigation system. Many navigation systems have a function to adjust the vessel symbol if an error is discovered in the coordinate system.
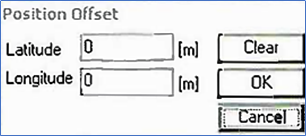
If a coordinate error is discovered in an area, for example by a comparison between the radar and satellite positions, the coordinates can be corrected by introducing offsets
1.1. Different presentation modes
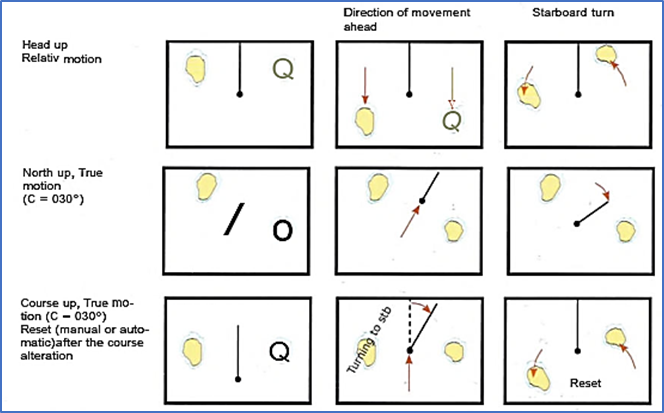
Just like a radar image, the image of an electronic chart can be oriented and moved in various ways, which results in a number of advantages and disadvantages.Head-up gives a screen with a perspective which resembles what the Navigator sees ahead of him. A disadvantage is that the image will rotate during a turn.
North-up gives an image that does not rotate, instead it is the head line that moves.
Course-up is a bit of both of the above. Ahead is up on the screen but the chart doesn't rotate during a turn, instead it is the head line that turns. The disadvantage is that the image must be reoriented manually to get the head line "head-up".
In Relative motion, RM, the image (land and other contacts) moves relative to the vessel symbol. The default setting is for the vessel symbol to be stationary at the centre of the screen but the Navigator can locate it Offcentre.North-up and Course-up can be combined with True Motion (TM). In this case the vessel symbol will move against a stationary chart image. When the distance between the vessel symbol and the edge of the screen becomes too small, or if the scale is changed, the image is moved back to the starting position on the screen.
ECDIS must be able to present Northup and True Motion, other presentations are optional.
|
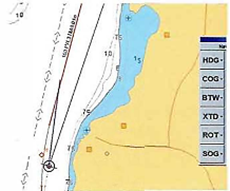
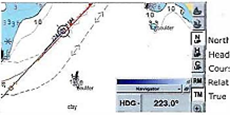
In Course-up presentation the vessel symbol moves up In the image. To the right a lot of navigational information |
North-up presentation gives an image that resembles a paper chart with the meridians parallel with the edges. The vessel symbol moves in the direction of the vessel's course |
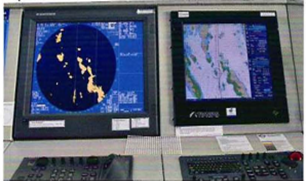
Electronic charts and radar can be combined: either on one screen as an overlay or, as in this case, using two screens
.
Radar and electronic charts have different strengths and weaknesses, as well as various ways to present images