How to use radio weather maps.
A large number of different types of radio facsimile cards are broadcast by various organizations around the world, but we use as examples those created by the US and Canada for the North Pacific. The principles studied in this publication can be applied to weather maps issued in accordance with standards established by the World Meteorological Organization and adopted by all countries.
Going to the distant voyage is very important to know the information about the upcoming weather. For seafarers, when navigating along the coast (up to 30 nautical miles), it is possible to obtain a weather forecast via VHF radio from shore services. At present, there are a number of weather stations transmitting weather faxes at different frequencies.
To receive a fax of the weather at longer distances, the following equipment should be used:
1. Single-band HF receivers with a range from 2 to 20 MHz;
2. A computer with a program for receiving weather faxes and a sound card. (program SeaTTY, allows to receive HF-FAX, NAVTEX, teletype RTTY);
3. Connecting cord, with which the sound card connects to the receiver;
4. Antenna (built-in receiver or external);
Fig. 1
Or FAX receivers .
How to take a weather fax?
1. Connect the equipment, as shown in Fig. 1. If the receiver, in addition to the headphone output, has a linear output, it is better to use it, since the signal level does not depend on the position of the volume control and you can control the signal level by ear. 2. Launch the SeaTTY program. In the "Mode" menu, select the operating mode HF-FAX.
3. Turn on the receiver, set to the frequency of the weather station. At the receiver, select the USB modulation.
How to use weather maps?
There are two types of weather maps: analysis and forecast maps.Analytical maps are based on meteorological observations, from which diagrams of maxima and minima are drawn, as well as the location of weather fronts. Undoubtedly, the analysis charts of surface weather conditions will be most often used, because they depict what is happening in real time. Weather observations are taken around the world at a specific time (0000, 0600, 1200 and 1800 GMT). From these observations and the use of satellite images of cloud peaks, surface analysis charts are printed for water and land every six hours.
There are two important factors that should be considered when using any surface analysis map.
- First, the picture of the weather above the ocean outside the main navigable can be based on very few observations. On board the ship there is no indication of how many observations were used for each chart, and whether the analysis is accurate or not, one must be sure.
- Secondly, the analysis chart does not show a diagram that exists during receipt on board the vessel, but is a template, since it was received three to six hours earlier, depending on which cards we chose to copy. This will be important in those weather situations when the weather changes rapidly, for example, deepening the lows moving at 40 knots. By the time we get the chart, the lows may lag 120 to 240 miles from where they were shown in the analysis. This can be compensated by simple methods, which will be considered below.
The use of ship barometers along with changes in the wind and other weather elements is a valuable tool for checking for changes in the weather cover. We can link the weather map with what we see in reality. The barometer reading on board the vessel to be compared with the map should give the true value of the sea level pressure, which usually means that the barometer readings have corrections correcting the rise and error of the instrument. All the isobars in the graph are designed for sea level pressure, and the readings we use to compare the chart should be taken during the observation used in the analysis. Do not be surprised if your chart differs from the pressure of your position on the analysis. Your weather forecast (if you are participating in a weather observation program) was not used for analysis for one reason or another (sometimes the messages are lost when transferred to various meteorological centers). If you are not in the weather observation program, your observation in any case can not be used. Observations will be analyzed using the best available information, and some guesses should be used when placing isobars, where data does not exist. In addition to the weather analysis charts on the surface, there are others that have more specialized applications. and some guesses should be used when placing isobars, where data does not exist. In addition to the weather analysis charts on the surface, there are others that have more specialized applications. and some guesses should be used when placing isobars, where data does not exist. In addition to the weather analysis charts on the surface, there are others that have more specialized applications.
Sea surface temperature analysis charts (SST) consist of isotherms (lines connecting points with the same temperature), in which regions of different water temperatures predominate. As ocean temperature changes occur rather slowly compared to the atmosphere, these maps can only be updated once or twice a week. They are based on measurements of sea temperature, depending on the suction temperature, bathymetric measurement and satellite weather images.
Forecast MapsAre weather maps showing weather conditions on the surface and a level of 500 millibar (about 4800-6200 meters above the Earth's surface) is produced by computers. Diagrams that give a forecast for 12-48 hours ahead are usually more accurate than those predicted for 72 hours, especially in rapidly changing weather conditions. To predict the weather for more than 36 hours, computer diagrams are needed, because the method of simply advancing the highs, lows and fronts based on their previous movements on the weather analysis maps becomes very unreliable. Experience has shown that 500 millibar on a weather map is usually more accurate in forecasting weather conditions at the upper level than predicting surface weather forecasts above sea level.
The lines drawn on 500 millibar bars look like isobars, but instead of being lines connecting points with equal pressure, they connect points with the same height, where the pressure is 500 millibar. They are called contour line lines or simply contours. The closer the contours, the greater the wind. The Navy broadcasts a whole series of 500 millibar charts, as well as other top-level diagrams.

Fig. 2.
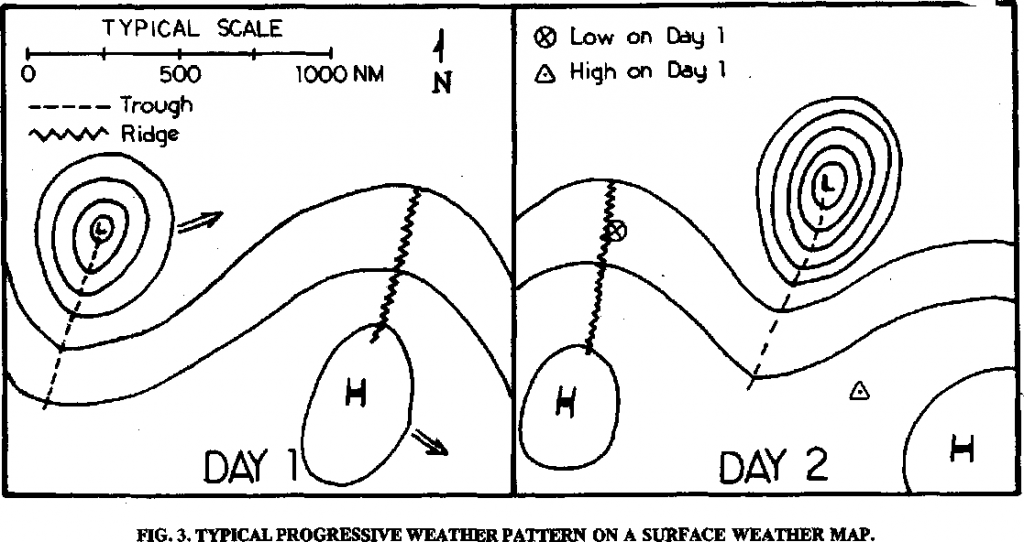
In a general sense, weather conditions shift with time to the east, but there are exceptions to this, so radiopharmaceutical cards are so useful. Sometimes the center of pressure can move north or south, and in some cases even west. Figure 3 shows a region with a low pressure center and an area with a high pressure center. The low pressure area is often a region of cloudiness and inclement weather, and also an area where the weather forms and departs from the low pressure center. The area of high pressure is often, but not always, a region of good weather.
Prognostic weather maps are usually drawn up a day ahead, but recently issued for a period of more than a day (up to 5 days). Usually on the forecast weather map isobars are presented, fronts are made, the centers of cyclones and anticyclones are designated.
When working with forecast maps, you should first of all pay attention to the period for which it was compiled.
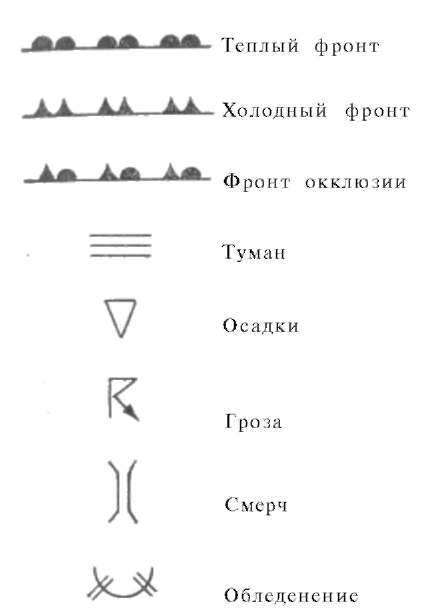
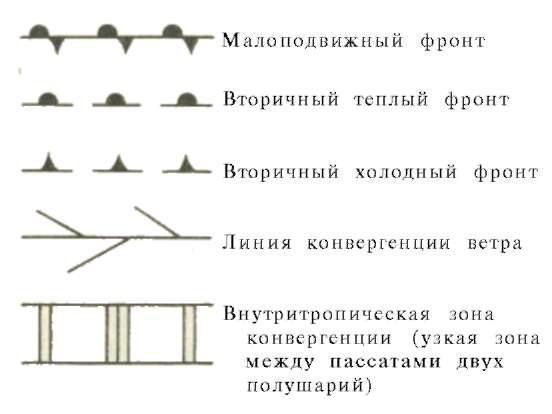
Legend on radiopharmal weather maps:


 +7 (812) 4-673-673