+7 (812) 4-673-673
Vector Charts
The advantage of vector maps is that they can be more powerful than paper and raster maps and require less storage space than raster maps.
Vector charts include innovative safety features that can activate or sound an alarm, for example, when shallow water crosses a pre-set course.
The information displayed and its intelligibility can be adapted to different situations and navigational requirements such as ocean, coastline, archipelago and harbor. They can also be adapted to different lighting conditions and other requirements.
1. Official vectorised electronic charts, ENC
Official electronic charts are charts published or approved by governments, national hydrographic institutes or other authorized agencies. By default, all other e-cards are unofficial, often referred to as privately-published e-cards.
Official ENCs (Electronic Navigational Charts) are compiled from the best available overviews and other information. However, this is not a guarantee that they are free from errors.
ENC means the database, standardized as to content, structure and format, issued for use with ECDIS on the authority of government-authorized hydrographic offices. The ENC contains all the chart information necessary for safe navigation, and may contain supplementary information in addition to that contained in the paper chart (e.g. sailing directions) which may be considered necessary for safe navigation. (IHO)
IHO has issued several standards that regulate the appearance of ENCs. The goal is to make ENCs appear the same on the screen no matter which country has published them and independent
of the ECDIS manufacturer. All ENCs shall be produced using the geodetic datum (chart horizontal datum) WGS 84.
The standards that govern the design of official ENCs are:
Transfer Standard for Digital Hydrographic Data, S-57, so that ENCs shall have the same characteristics regardless of publisher. (S-57 will be replaced by S-100 and S-101 but will continue to be used for the foreseeable future). The S-57 standard is a catalogue comprising the various object classes that make up charts, for example marks, administrative areas such as anchorages and other boundaries, etc., etc.
Each object is given by its position and is allotted attributes that describe it, such as type, height, period of validity, etc. The object class and attributes are coded together with the position. The navigational program then visualises the electronic chart on the screen on the basis of these instructions. S-57 defines about 160 object classes and 190 attribute classes.
The survey data in the S-57 database is not presented in any specific projection. This is added by the electronic chart publisher.
The object class cardinal buoy (BOYCAR) may have up to 20 or so attributes. One of them is BOYSHP (Shape of Buoy). Others are COLOUR, COLPAT (Colour pattern).
S-63 regulates the encryption of ENC in order to prevent illegal copying and corruption of material in its passage from publisher to user.
The term ENC is not a trade mark and can also be used by private publishers of electronic charts. To avoid ambiguity the prefix "official" is often used.Official ENCs are published by the official hydrographic institutes of various nations. These have differing resources available to them and are responsible for surveying areas of varying difficulty. This means that ENCs cannot be assigned a global, uniform guarantee of quality. However the quality of information is categorised by assigning a Zone of Confidence (ZOC, see p. 52) to a given chart. Official ENC are not free from error but should be regarded as the "best available" electronic charts.
The responsibility for issuing official electronic charts is divided between states so that there is only one official ENC for a given area.
ENCs are compiled as "Cells". A cell is a spherical rectangle bounded by parallels of latitude and by meridians. Adjacent cells do not overlap. Their scale depends on the intended use. The only restriction on size is that the size of the cell shall not exceed 5 MB.
An official ENC is created by a chart editor. On the basis of the intended use of the cell, the editor chooses the information to be included on the chart from a database. So, for example, an overview cell will not contain all the information available for the area. Most of this will be assigned to other cells for use in coastal and archipelago navigation. Just like on paper charts, a cell is published to a given
scale (compilation scale).
ENCs are published for the following areas of use:
- Berthing
- Harbour
- Approach
- Coastal
- General
- Overview
For safety reasons ECDIS shall trigger an "Overscale Warning" for either of two conditions: when the production scale is exceeded, or when the vessel does not have a cell that comprises the larger scale. There are many examples of situations when a Navigator relied too heavily on the accuracy of a "small-scale electronic chart and relaxed the margin of safety.
ENCs shall provide adequate conditions for ECDIS to generate warnings concerning an imminent risk/danger in relation to the position of the vessel and its movements. A precondition for the depth alarm to work is that the depth contours form completely enclosed areas on the electronic chart. Only when this condition is satisfied can the Look Ahead function in a navigational program decide when it intersects such an area ahead of the vessel.
The screen area is usually smaller than the size of a paper chart. This creates problems "to get the whole picture". The screen has to be capable of displaying electronic charts from entire oceans to harbour specials. A number of characteristics of vector charts must therefore be fulfilled in order to ensure legibility in all situations.
2. ENC from computer to screen
The amount of information in vectorised electronic charts that is displayed on the screen varies, for several reasons.
In document S-57 (Transfer Standard for Digital Hydrographic Data), every object is described by its position and attributes. Some attributes have a special effect on the screen presentation:
-
PERSTA, PEREND (period start, period end) limit the display of seasonal symbols to their period of operational validity.
-
DATSTA, DATEND (start date, end date) are used when a symbol shall be entered or deleted on a given date, for example when a new Traffic Separation System (TSS) is to take effect.
-
SCAMIN (least scale) governs most symbols and regulates the least scale at which a symbol shall not be displayed. This has the same effect as the generalisation of information on charts at different scales in order to make them clearly legible and appropriate for use under different conditions, such as archipelago or coastal navigation. For example harbour details will not be shown on an electronic chart intended for coastal use. Details disappear as the chart is zoomed out. This standard is, however, interpreted by different publishers in somewhat different ways.
-
When an electronic chart is to be displayed, it is projected onto the screen and for ENCs the system retrieves symbols from a socalled "Presentation Library, S-52". Privately-published electronic charts will show the publisher's i symbols.
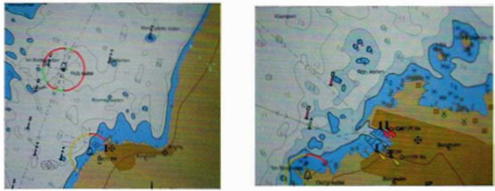
Electronic charts of type S-57 at different scales, with different amount of informatio
ENCs shall display symbols according to S-52 Presentation Library from IHO. Unofficial electronic charts do not use symbols that are standardised in the same way.
The Navigator can influence the content of vector electronic charts with adjustments that depend on actual conditions, for example ocean, coastal or archipelago navigation, good or poor visibility and even depending on the individual's own opinion as to what should be displayed on the screen. (Worth calling attention to when the watch is taken over).
Symbol definitions for ECDIS are usually found under a Menu. The UK Hydrographic Office publishes a "Guide to ENC Symbols''
3.1. Coastline, depth contours and dangers to navigation with special symbols
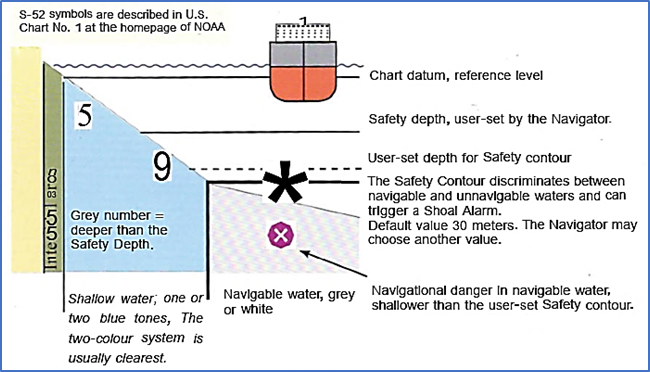
The land, with a coastline and associated depth contours, defines areas on a vector map. Navigation systems allow a user-defined heading vector or other safety zone to trigger an alarm when it crosses a designated depth contour.
The safety loop is an adjustable parameter in navigation systems. It marks a user-defined depth contour with a bold black line. If there is no exact depth contour on the map, the system will select the next deepest contour by default. Shallow waters within this circuit, i.e. non-navigable waters are marked in blue (one or two shades), and depths outside the Safety Loop will be gray or white. The system uses the Safety Loop to generate an alarm, provided this function is activated.
Isolated dangers, e.g. a wreck in navigable water, are marked by the purple symbol when they are shallower than the user-set Safety contour.
If the Safety Contour is userset for, say, 12 meters and the chart displays 10, 15 and 20 meter contours, then the 15 meter contour will be marked.
If an adjacent electronic chart should lack the 15 meter contour then the 20 meter contour will be marked on that chart. If no Safety contour has been set then the default setting in ECDIS is 30 meters.
If the water surface is displayed using two colours then the dividing line is based on the Safety Contour. If four colours are used then two shades of blue will be used on either side of the "Shallow contour". Outside the "Deep Contour" the water surface is white.
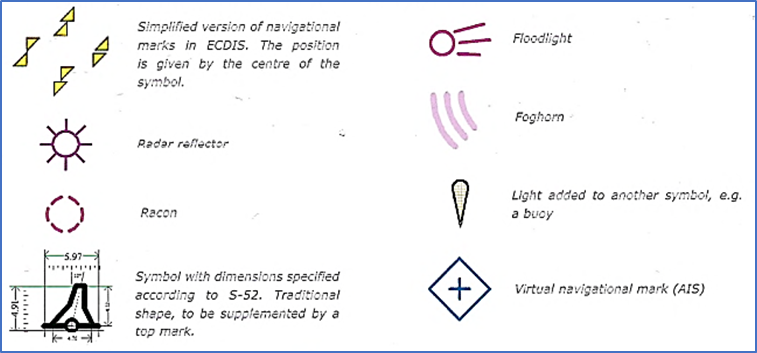
Some symbols from S-52 that differ from the conventional chart symbols
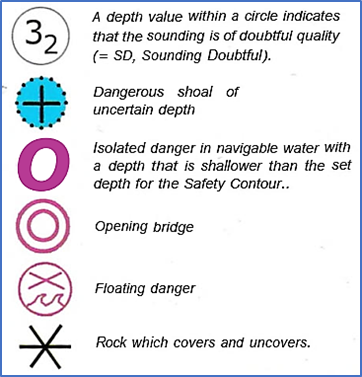
Floating marks have two classes of symbols, one like those on conventional charts and in addition a simplified version that is intended to give better visibility in reduced lighting conditions on the screen.
Symbols reproduced with permission from the International Hydrographic Organisation.