 +7 (812) 4-673-673
Types of electronic charts
Electronic charts are shown on a screen: this may be part of a chart plotters or a dedicated navigational computer. The main ideas behind electronic charts connected to a position source is to relieve the Navigator of much routine work connected to paper chart navigation, and make possible the introduction of alarms. Ideally these improvements should enhance situational awareness.
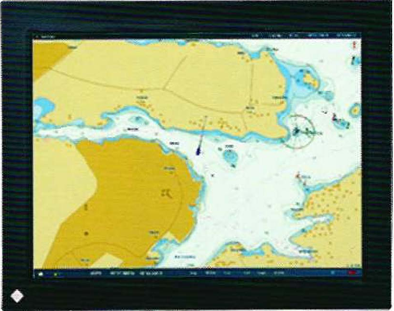
The electronic map in the navigation system is more than just a map on the screen
Types of electronic charts
here are two types of electronic chart, distinguished by their production process: raster and vector charts. TjuvholmsElectronic charts are further classified as official or unofficial, depending on the manufacturer. Raster charts are scanned copies of existing paper charts. When displayed on a screen raster electronic charts have a strong resemblance to the appearance of paper charts.
The vectorisation of nautical information is a labourintensive procedure, as a result of which raster charts still cover a larger area of the oceans at the time of writing. This is especially true of regions with less traffic. However, vectorised charts are capable of incorporating a number of interesting functions, so the tendency is for vector-chartsto cover more and more of the world.
A chart contains information that the cartographer has chosen on the basis of the intended use. Rasterised charts contain the same amount of information as the equivalent paper chart, sometimes supplemented with additional information in a second data layer. Vectorised charts can contain much more information.
The main differences between paper- and electronic charts:
- the screen is usually smaller than paper charts, so there is a need for scrolling and panning.
- the scale is adjustable, like a radar.
- there are several manufacturers and their products can have important differences for the user.
- there are several manufacturers of the navigational program that project the electronic chart on the screen. This can have effect on what is shown on the screen.
- there are a huge amount of adjustments. Some are for the comfort of the Navigators, such as the light intensity of the screen. Other are very important in order to show the facts that the Navigator need, depending on the navigational situation at hand.
- electronic charts are more easily kept up to date.
- most electronic chart symbols are similar to those on paper charts, but this is not always the case.
After a change in the SOLAS regulations the chart requirements can be met by official electronic charts in an ECDIS installation, as long as there is either another, independant, certified ECDIS or up-to-date paper charts as back-up.
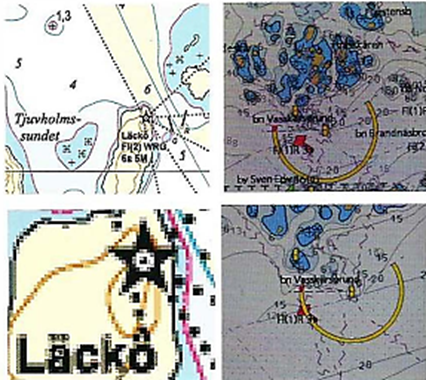
Lines and areas on a raster chart are built up from pixels. On zooming, all details are enlargedlines broaden, etc.
Lines and areas on vectorised charts are formed by commands that create the image. On zooming the details retain their relative sizes although they are in the end also built up from pixels.
In addition the vectorised chart can be influenced by the publisher and the Navigator in quite a number of ways.
Note that the names in the chart images to the right, do not get larger when the image is zoomed.