 +7 (812) 4-673-673
Navigational errors
Navigational or too ascold clocks , soinstruments gonavigational fast or slowseldom instruments, thermometers show including correct show too readings the warm compass, log, radar and satellite receivers, can show somewhat incorrect readings. The Measurement error is defined as the difference between the true value and the measured value.
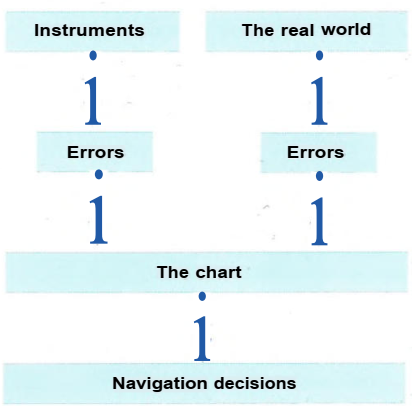
The Navigator reads off the instruments or make visual observations. Corrections are made for known errors. The observations are plotted on the charts which are concidere to be a model of the real word. But charts are not perfect depictions of the real word. Even satellite receivers and ectronic charts have errors. The Navigator has to judge the safety margins depending on the quality of observations and of charts
Errors result in the inability to transfer results .from an instrument directly to the chart, or that the value presented on the electronic chart is not correct.
The navigational sum of errors accuracy fromandinstruments must be managed and methods by anaffects quate safety margin. Calculating and judging sources of error is one of the most important tasks of the Navigator and one that recurs constantly.
Sources of errors can be corrected with:- calibrating instruments, both electronic and mechani cal
- mathematically adjusting an observed value using a correction factor.
Chartwork
When navigating with paper charts, courses, distances and bearings will be plotted on the chart. Navigation system show the position automatically, but it is possible to work out courses, distances and bearings even on an electronic chart.
In principle areas, angles and distances can be measured to their correct values on a globe but in order to describe the surface of the earth on a plane surface at least one of these parameters must be sacrificed. (The exception is for charts over small areas such as a harbour)
The problem was solved by the use of chart projections, which are mathematical methods or geometrical constructions in which every point on the surface of the earth is represented by a corresponding point on the chart. It is, however, necessary to choose a projection that as far as possible gives a representation suitable for the need on hand.
Chart errors can be angular, areal or distances. Angles and distances are important for the navigator but areas matter less.
Equidistant projections preserve distances from some standard point or line.
Conformal projections reproduce local angles on the earth's surface with the same angle on the chart
Equal area projections reproduce areas in their correct relative proportions.
There are a considerable number of different methods of projection, each with its own more or less severe differences compared with the surface that it reproduces. The choice of a projection depends on the necessary characteristics of the final product and one should be aware that other aspects of the chart will be less realistic.
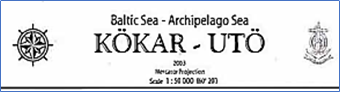 Chart title with projection and scale
The Mercator projection was invented in 1559 by Gerhard Mercator and since then has been the most used projection for navigation at sea. The angle of the cxodrome can be measured anywhere on the chart using a protractor.
In order that the loxodrome, which cuts all the meridans at the same angle, shall be a straight line on the cnart then the meridians must be parallel in spite of the fact that in reality they converge on the poles.Mercator achieved this by keeping the longitude minutes constant on the chart and increasing the latitude minutes to the same extent as the longitude minutes should have decreased. This keeps the relationship between minutes of latitude and minutes of longitude correct..
2. The Gauss chart
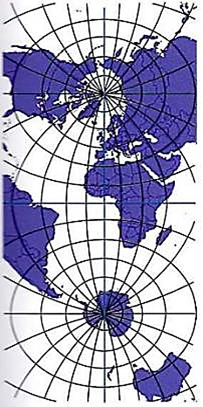
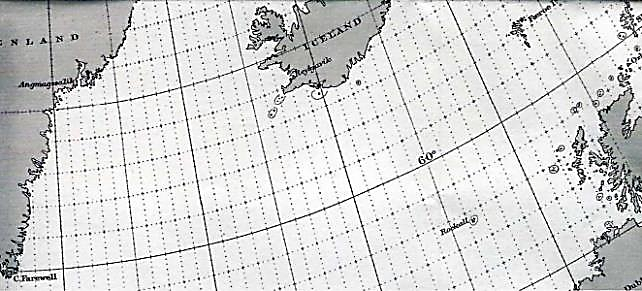
This projection considers the glooe as contained within a cylinder and the points on the surface of the earth a-e projected onto it. The cylinder makes a tangent to ore earth along a meridian. The points on the surface "the earth closest to the contact with the tangent a-e projected with small errors. The Gauss projection is especially suitable for reproducing regions in the high latitudes with a mainly north-south
orientation. It is sometimes known as the Transverse Mercator.
The meridians are represented by curved lines that meet at the poles. The scale of longitude increases with distance from the tangent meridian. The loxodrome is not a straight line. When a small area close to the tangent meridian is represented at a scale of 1:50000 or larger then the Gauss chart can be used as a Mercator chart since the errors are then insignificant.
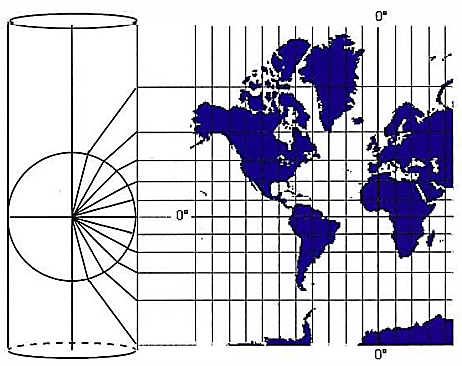
The most important feet:. , as of the Mercator chert are:
- The meridians are straight pars!!ei lines
- The parallels of latitude are straight paralie! fines
- The paraHells of latitude cross the meric! :ans of longitude at right angles
- The scale increases from the equator to the poles
- The loxodrome is represented by a straight line.
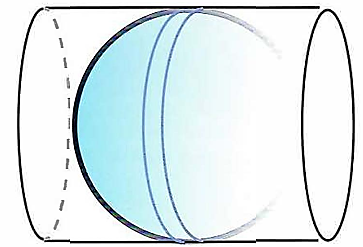
The Gauss chart can be thought of as constructed by mathematically transferring coordinates on the earth's surface to the surface of a cylinder that is arranged tangentially to a meridian. Under these conditions points dose to the tangent will exhibit insignificant distortions.
Over the open ocean a navigator can choose to follow a great circle, since the distance is shorter than along the loxodrome. A great circle will always take one closer to a pole than the loxodrome, which can result in worse weather along the great circle. One compromise is to combine stretches of great circle and stretches of loxodrome, a so-called composite sailing. Great circles are drawn as straight lines in Lambert's conformal conic projection and the Gnomonic projection.
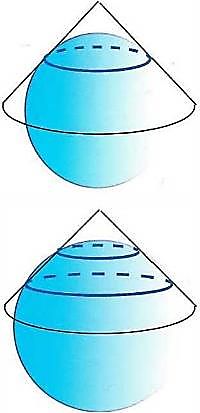
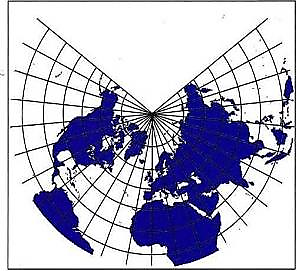
In the same way one can imagine coordinates on the earth's surface transferred to a virtual cone that forms a tangent to the earth. A cone cutting the earts surface at two standard parallels gives a chart with small distorsions in those areas.
In addition to working out courses (chapter 6) and positions (chapter 7) on the chart, the navigator will also have to
consider questions such as "How long will it take to reach ...?" and "How far have we come at this speed?
How fast are we going?" and so forth.