 +7 (812) 4-673-673
Charts
The navigator needs information about shallow water areas, obstructions, harbour positions and other nautical information. Much, but not all, of this may be found in charts. Different methods of navigation make different demands on the charts.
1. The shape of the Earth
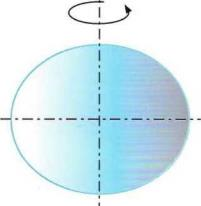
A rotational ellipsoid is produced by rotating an ellipse around one of its axes. In the case of the Earth this is the short axis
When navigating close to land the navigator can regard the surface of the earth as flat. For navigation across oceans and for astronomical navigation the earth is regarded as a sphere. If a more accurate model of the shape of the earth is needed, for example for hydrographic work, then the preferred shape is a rotational ellipsoid. Over the years many different ellipsoids have been devised in order to suit the needs of different countries, such as Bessel, Clarke, Hayford, Svanberg and the currently used WGS 84 (World Geodesic System).
 The coordinates of the WGS 84 POSITIONS system can be directly mapped
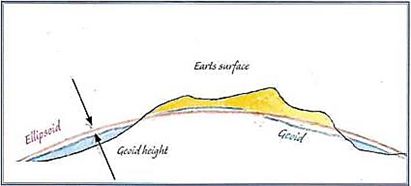
The globe, however, is not a perfect rotational ellipsoid. The comparison that most closely approximates to reality is that it resembles a knobbly pear and the shape which most closely describes the situation is called a geoid. A somewhat simplified definition of the geoid is the virtual plane that coincides with the undisturbed average sea level and its extension in under the continents.
The difference between the ellipsoid and the geoid is called the geoid height. This can vary by as much as 100 meters below and up to 85 meters above the average sea level.
For satellite navigation a global geodetic system (geodetic datum) called WGS 84 is used and nowadays most charts are drafted using this ellipsoid.
2. Coordinate system
A coordinate system applied to the surface of the earth is a solution to the need of describing and managing the positions, directions and distances that are parts of the work of navigation.
The coordinate system of the earth is built up in the following way:
-
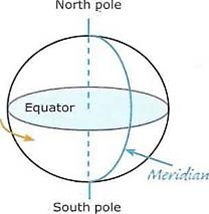
The earth rotates with a constant rate around an imaginary axis. The points where this axis intersects the surface of the earth are called poles.
-
The intersection of the surface of the earth and a plane that passes through the centre of the earth at a right angle to its axis is called the Equator.
-
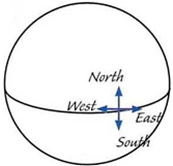
The direction in which the earth rotates is called "East". The opposite direction is called "West".
-
The North Pole is the pole that is on the left side of a person who, is looking in an easterly direction. The direction towards the North Pole is called "North". The opposite direction is called "South.
-
Meridians are semicircles that join the poles. Plotted on a chart they therefore show the geographical (often called the true) North-South direction.
A position on the surface of the earth can be defined by angles from two planes of reference:
-
The Equator
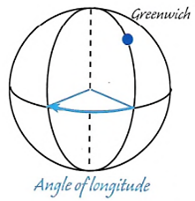
- The meridian through the Greenwich observatory, close to London
Longitude is the angle at the centre of the earth between the Zero meridian through Greenwich and the meridian that intersects the position. Longitude is called East or West depending upon which side of the Greenwich meridian that it is found. Longitude is measured from 0° to 180° in both directions.
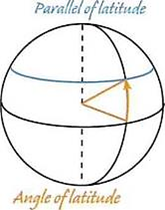
Latitude is the angle at the centre of the earth between the Equator and a virtual line to the position. Latitude is termed North or South, depending upon which side of the equator it is positioned. Latitude varies between 0° and 90°.
Parallels of latitude run parallel to the equator and connect positions of the same latitude. Meridians connect positions on the same longitude and their plane contains the axis of the earth.
The coordinate system of charts has for hundreds of years been based on a circle divided into 360°.Each degree is subdivided into 60 minutes (').
Minutes are usually sub-divided as decimals, but
they may also be sub-divided into 60 seconds of arc (")
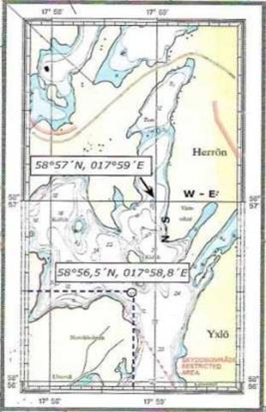
It is conventional to set out positions with latitude first, specifying north or south of the equator. For longitude one specifies east or west of Greenwich, for example:
58° 57'N, 017°59'E
Another convention replaces the degrees sign by a hyphen and the minutes are not written down. 58-57N, 017-59E.
The most common convention is to divide minutes
into tenths, hundredths and thousandths of a minute
but some chart plotters show coordinates with only degrees and decimals of a degree.
When constructing charts the coordinate system is used to position every object in its correct place.
The navigator uses coordinates when:
- determining a position using a satellite receiver.
- localising an object on the chart or transposing a position from one chart to another.
- correcting a chart.
- in nautical calculations, for example the distance and direction between places using their coordinates. ("The sailings") specifying a position when in distress.
| On many charts the coordinate system appears as two sets of straight parallel lines that cut each other at right angles |
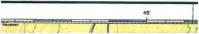
As a result of an international agreement in 1884, the international Zero meridian is that which goes through Greenwhich Observatory (outside London). The zero meridian is inlaid in the roadway outside the door |